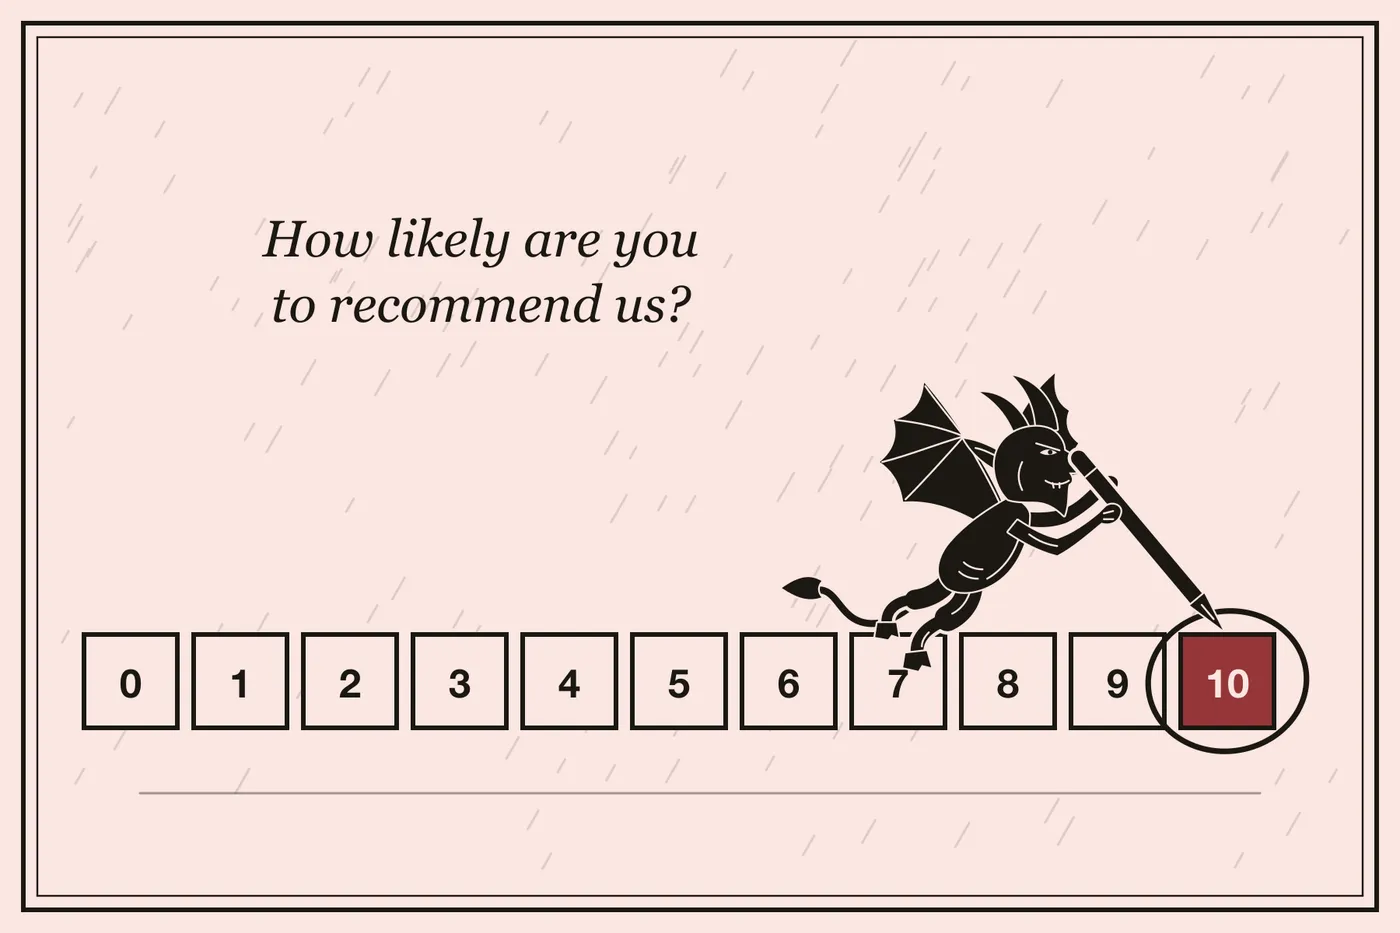
Is NPS dead? Not even slightly. At least two-thirds of the Fortune 1000 use the Net Promoter Score (Fortune), and it turns up on board slides, in investor presentations and in the bonus plans of people who answer customer calls. What died years ago is the promise that made it famous: that one question predicts a company’s growth better than anything else you could ask.
I think NPS survives for a less flattering reason. It is a herd metric. Everyone reports it, so nobody has to defend it. It fits on one slide, and the competition has one too. That makes it comfortable, and comfort is not evidence.
My advice is the one I’d give about any single number: use NPS as one signal among several, and never make it a target. When I wrote about the trade hollowing itself out in You killed market research, NPS got one paragraph as the classic way to hide in the herd. This is the long version.
What is NPS, and where did it come from?
Fred Reichheld, a consultant at Bain & Company, introduced the score in “The One Number You Need to Grow,” in the December 2003 issue of Harvard Business Review (HBR). Customers answer one question: how likely is it that you would recommend the company to a friend or colleague, on a scale from 0 to 10. Those who answer 9 or 10 are promoters, 7 or 8 passives and 0 to 6 detractors. The score is the percentage of promoters minus the percentage of detractors, so it runs from -100 to +100.
The pitch was as simple as the arithmetic. Companies were spending a fortune on long satisfaction surveys that measured the wrong thing, Reichheld argued, while willingness to recommend was the number that tracked growth. He expanded the idea into a 2006 book, The Ultimate Question.
How he got there is harder to see. A 2023 working paper by Sebastian Lundmark, Jon Krosnick and colleagues notes that the 2003 article claimed to have studied more than 400 companies, yet only about 50 seem to have entered the analysis, and graphs were published for 14 (Lundmark et al., 2023). The survey invitations went to addresses bought from opt-in email lists. Which companies were included, and which rival measures NPS was compared with, has never been made public.
Does NPS predict growth? What the research found
The first serious test came in 2007. Timothy Keiningham, Bruce Cooil, Tor Wallin Andreassen and Lerzan Aksoy re-ran the analysis with longitudinal data from 21 firms and more than 15,500 interviews from the Norwegian Customer Satisfaction Barometer, and checked it against the American Customer Satisfaction Index. In the very industries the method’s developer had cited as showcases, the claimed clear superiority of NPS over other loyalty measures did not hold (Keiningham et al., 2007).
The same group, with Jay Weiner, then tested the claim at the level of individual customers. They followed more than 8,000 customers of banks, mass-merchant retailers and internet providers for two years. Intention to recommend, on its own, wasn’t enough to predict who stayed, who recommended and how much of their spending a company got, and several measures together did better (Keiningham et al., Managing Service Quality, Vanderbilt University).
Later studies, in other countries and with other data, kept landing in the same place:
- With Dutch customer and company data, Jenny van Doorn and colleagues found that all the metrics they tested explained current growth equally well and predicted future growth equally badly. “The NPS is neither superior nor inferior to other metrics,” they concluded (van Doorn et al., 2013).
- Evert de Haan, Peter Verhoef and Thorsten Wiesel surveyed customers of 93 firms in 18 industries and checked two years later who had stayed. The share of customers in the top two boxes of a satisfaction scale predicted retention best, the official NPS came close behind and combining the two beat either one (de Haan et al., 2015).
- In a New Zealand business-to-business company, five years of scores matched to revenue showed that promoters spent more in the current year, but they were a minor and inconsistent source of growth from existing customers (Mecredy, Wright and Feetham, 2018).
- The Lundmark and Krosnick team analyzed five US surveys covering 30 companies. NPS was not a reliable predictor of revenue growth however they calculated it, worded the question or modeled the relationship. The closest thing to a predictor was asking people how many times they had actually recommended the company recently.
The fairest counterpoint comes from Sven Baehre and colleagues, who used five years of data on seven US sportswear brands (Baehre et al., 2022). They found that the original idea behind NPS is reasonable, that the academic objections are valid too, and that one version predicted future sales growth well: a brand-health NPS asked of all potential customers, not only of existing ones.
Nearly two decades of tests point the same way: NPS is about as good as other attitude questions, and no better. That is not nothing. It’s just not the one number you need.
Why is NPS noisier than it looks?
The scale throws information away. A 0 and a 6 count the same, and a 7 and an 8 count for nothing. Calm a furious customer from 1 to 6 and the score doesn’t move; nudge a contented one from 8 to 9 and it does.
The score is the difference between two percentages, so its margin of error is wide. Here is my own arithmetic: 300 answers with 45% promoters and 20% detractors give an NPS of 25, with a 95% margin of error of about 9 points either way. Compare two quarters of 300 answers each and the score has to move about 12 points before you can say anything changed. Plenty of quarterly reviews celebrate five.
It also hears only from the people who get asked, usually current customers just after a purchase or a call. Robert East, Jenni Romaniuk and Wendy Lomax pointed out that ex-customers and people who never bought, who voice much of the negative opinion about a brand, aren’t in the sample at all (East, Romaniuk and Lomax, 2011). And nobody audits it. In a 2021 interview Reichheld himself said that because the score isn’t audited, companies calculate it differently and can’t be compared with one another (FS Forum).
How does NPS get gamed once it’s tied to pay?
This is Goodhart’s law in its natural habitat. The moment a score decides a bonus, people work on the score, and the cheapest way to raise a survey score is to work on the survey.
The best list of abuses comes from the inventor. In “Net Promoter 3.0,” published in Harvard Business Review in 2021, Reichheld, Darci Darnell and Maureen Burns describe practitioners who tied scores to bonuses for frontline staff, who then cared more about their scores than about serving customers (Bain). They list pleading for good scores, bribery (“free oil changes for a 10”) and not sending surveys to customers whose claim had been denied. Self-reported scores, they concede, have damaged the credibility of the whole system.
Fortune collected the street-level versions in 2020: car salespeople telling buyers they won’t be able to feed their kids without a 10, employees who changed a customer’s phone number to their own and rated themselves, and managers with NPS bonuses who color-coded the scale or told customers that only a 9 or 10 counted (Fortune). A banker quoted in the piece put it best: the surest way to a bad NPS program is to incentivize the scores. Reichheld told an interviewer in 2021 that people misuse NPS 90% of the time.
A score that staff beg for is a fake review with a spreadsheet attached. It measures how well your people coach customers, which is a skill, but not the one you meant to measure.
Why do companies like NPS anyway?
The case for NPS deserves a fair hearing, because it is a real case:
- One question means a short survey, more answers and a small bill.
- A board can understand it in one sentence, and a chief executive can remember it.
- The follow-up question, “why?”, often produces the most useful text a company collects about itself.
- In my experience, an NPS program is often what finally gets someone to call unhappy customers back, and that is real work for real customers.
- The research doesn’t say it is useless. It predicts retention about as well as satisfaction does, and one version predicted sales.
Then there is the herd. Every competitor has a score, benchmarks exist and nobody gets fired for reporting the industry’s favorite number. A metric everyone uses feels safer than a better one nobody else has.
A high score is also not a health check. In February 2023 The Motley Fool held up First Republic Bank’s record NPS of 80, against a banking average of 31 (The Motley Fool). On May 1, 2023, California regulators closed the bank, and JPMorgan Chase took over its deposits (FDIC). The FDIC’s review blamed a run on the bank after the collapse of Silicon Valley Bank and listed “overreliance on uninsured deposits and depositor loyalty” among its weaknesses (FDIC).
None of that is the score’s fault. A recommendation question was never built to measure interest-rate risk, and the customers who loved the bank were not wrong about its service. But it shows exactly what a great NPS can’t tell you.
What should you measure alongside NPS, or instead?
Start with what customers do, and use what they say to explain it:
- Retention by cohort: of the customers who joined in a given month, how many are still buying a year later.
- Repeat purchases and share of wallet: how much of what customers spend in your category comes to you.
- Referrals that actually happened. Ask new customers why they came. Reichheld’s own 2021 fix, which he calls earned growth, separates revenue from returning and referred customers from revenue bought with marketing. In the Stanford-led study, the count of past recommendations came closest to predicting growth.
- A top-two-box satisfaction score, which did at least as well as NPS at predicting retention.
- Complaints, the open answers to “why?”, and how quickly the problems behind them get fixed.
- Ex-customers and people who never bought from you, who are missing from most customer surveys.
If you report NPS, report the number of answers and the margin of error next to it, and keep it out of everyone’s bonus. Each of these numbers is a model of what customers think, and all models are wrong. The point of having several is that they are wrong in different ways.
My take
NPS isn’t dead. It has been demoted, and many of the companies reporting it haven’t noticed. The question itself is fine: whether a customer would put their own name behind a recommendation is worth knowing.
What deserves to die is the faith around it: that one number predicts growth, that scores compare cleanly across companies and that paying people to raise the score makes customers happier. The evidence for the first is weak, the second fails without an audit, and the third reverses itself the moment the bonus arrives.
Treat NPS as a gauge, not a thermostat. Read the answers to “why?”, watch what customers actually do, and when someone presents a four-point rise as a triumph, ask how many people answered. Herd metrics survive because nobody asks.
Questions people ask
Is NPS dead?
No. At least two-thirds of the Fortune 1000 use it. What has died is the original claim that one recommendation question predicts growth better than other customer metrics: replication studies since 2007 found it does about as well as other measures, and no better.
How is Net Promoter Score calculated?
Customers say how likely they are to recommend a company on a scale from 0 to 10. Those answering 9 or 10 are promoters, 7 or 8 passives and 0 to 6 detractors. NPS is the percentage of promoters minus the percentage of detractors, so it runs from -100 to +100.
Does NPS predict revenue growth?
Not reliably. Studies with data from Norway, the Netherlands and the US found that NPS predicts growth no better than satisfaction scores, and a 2023 study of 30 US companies found it was not a reliable predictor at all. A 2022 study found that a brand-level version, asked of all potential customers, did predict sales of sportswear brands.
What should companies measure instead of NPS?
Behavior first: retention by cohort, repeat purchases, share of wallet and referrals that actually happened. Alongside those, a top-two-box satisfaction score and the open answers to ‘why?’ are worth more than the NPS number itself.