The matrix question is the most efficient thing in a questionnaire, for the person who writes it. Ten statements, one agreement scale, one tidy table: the survey looks nine questions shorter, the client gets one chart, and the analyst gets ten neat columns of numbers. The person answering gets a wall of identical circles. On a phone, where most surveys are now answered, the wall doesn’t even fit on the screen.
Are matrix questions bad? One grid won’t ruin a study, and a few careful experiments find that a short, well-built grid holds up fine. But most of twenty years of research points the same way: grids get more straight lines and less thought than the same items asked one at a time, and the gap is wider on smartphones. I think the matrix question is a nail in the coffin of online research. Not the murder weapon, a nail: small, cheap, and hammered in by the thousand.
In Participation is not engagement I argued that a completed survey proves participation, not attention. The grid is where that difference gets manufactured at scale. This is the first of two posts: here, the format itself and what phones do to it. Next, the big survey platforms that ship it as the default.
What is a matrix question?
A matrix question is a set of items, shown as rows, that share one answer scale, shown as columns. You pick one column in every row. Survey software calls it a grid, a matrix table or a rating-scale battery; in market research it is usually a battery of Likert-type statements with five or seven agreement points.
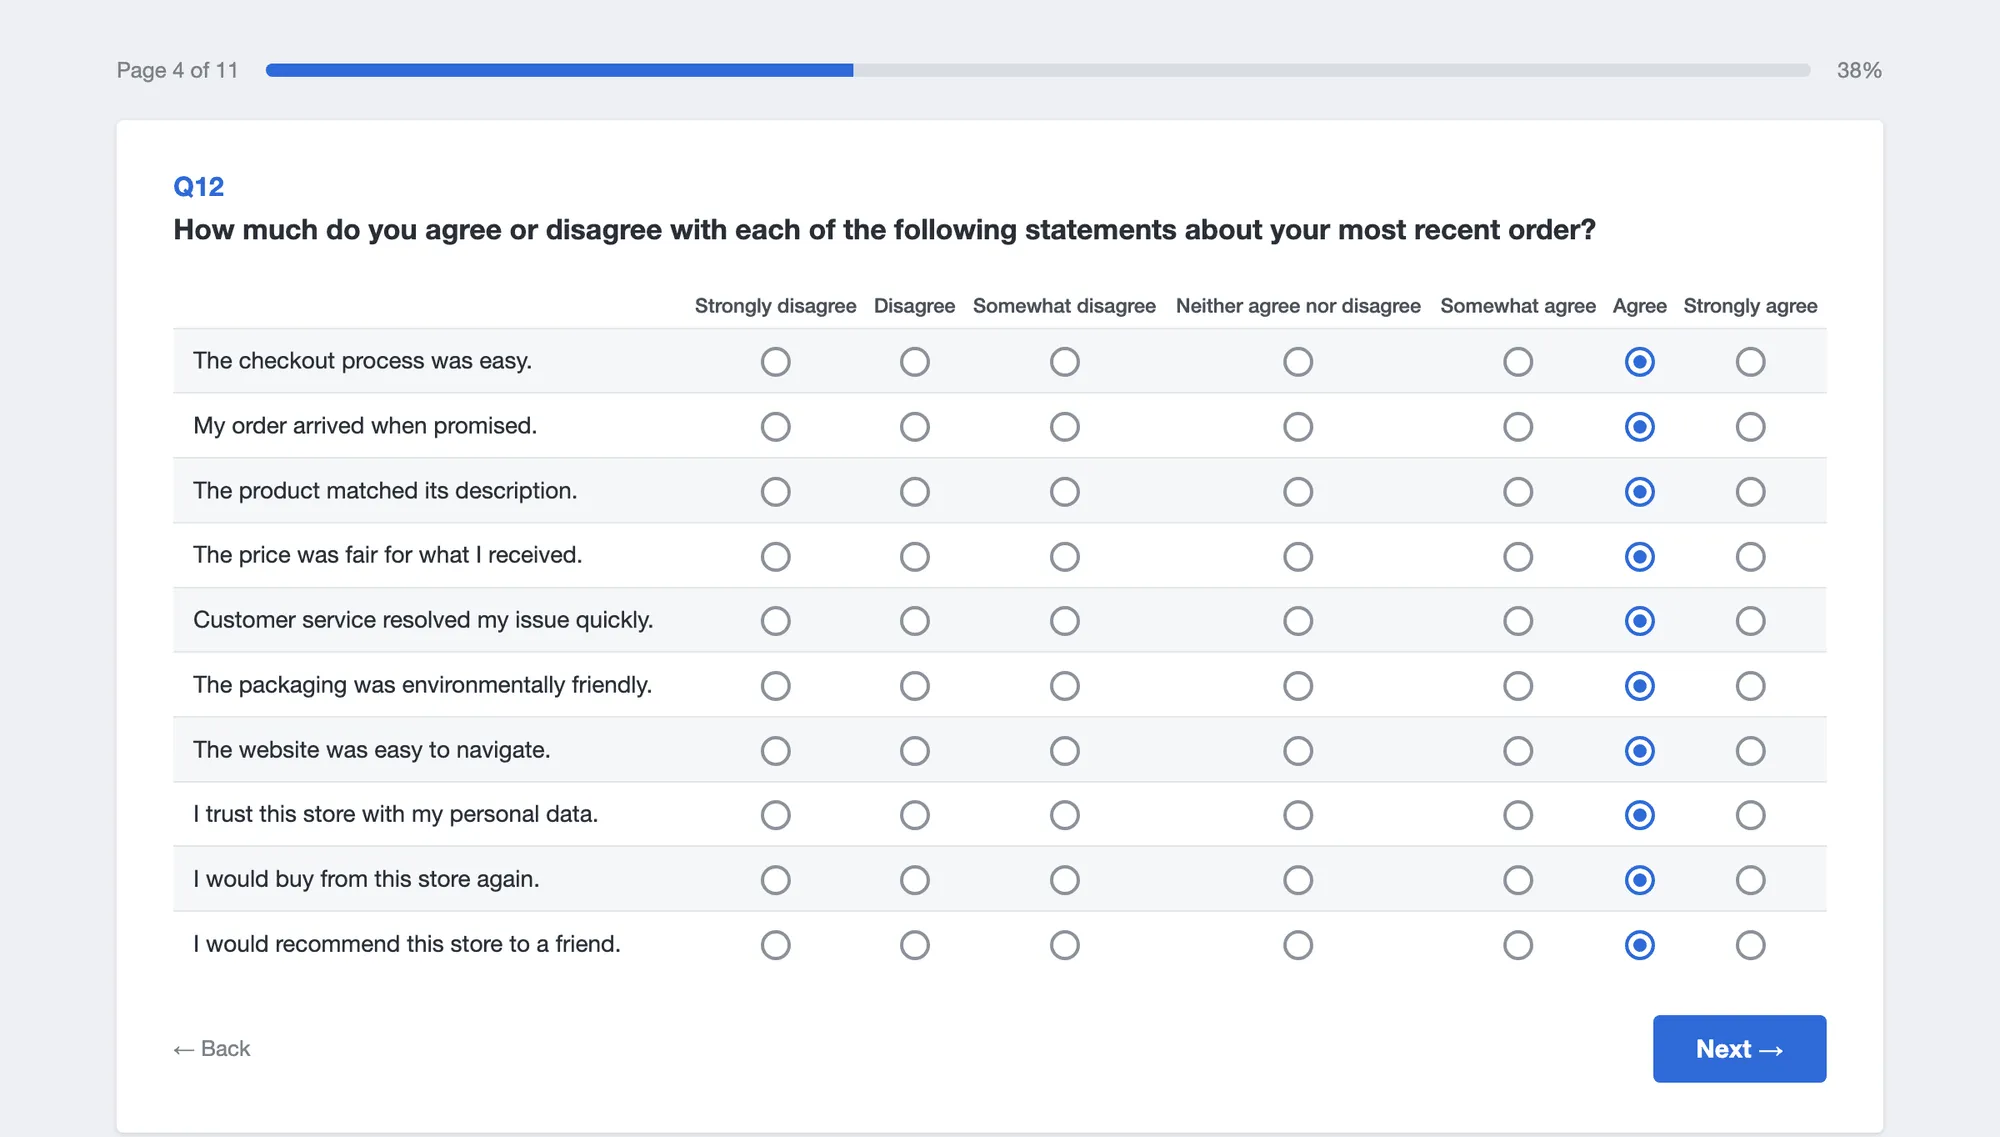
It’s easy to see why everyone likes it. It is quick to write, the scale needs explaining only once, it maps one-to-one onto a spreadsheet, and every survey tool has it. It also makes a questionnaire look shorter than it is. Ten statements in a grid count as one question in the progress bar, in the client’s draft and in the author’s head.
Why do matrix questions get worse answers?
The theory is old and unflattering. Jon Krosnick described in 1991 how respondents cope when answering well takes effort: instead of the best answer, some give one that is merely good enough. He called it satisficing, and one of its forms is failing to differentiate between items, giving them all the same rating (Krosnick, 1991). A grid makes that shortcut physical. Same scale, same position, same column, one tap per row.
The experiments bear it out. Roger Tourangeau, Mick Couper and Frederick Conrad found in 2004 that answers to a set of items were most strongly correlated with one another when the items all sat on the same screen (Tourangeau et al., 2004). Joss Roßmann, Tobias Gummer and Henning Silber ran two experiments in Germany: in an opt-in panel, 16% of respondents straightlined the grid against 10% with the same items asked one by one, and in a probability-based panel 10% against 4% (Roßmann et al., 2018). A Russian study of 1,678 panelists found more straightlining and lower validity in grids on both PCs and smartphones, and respondents reported more technical trouble and rated the survey lower (Mavletova et al., 2018).
The matrix usually carries a second problem in with it: the agree/disagree scale. Willem Saris, Melanie Revilla, Jon Krosnick and Eric Shaeffer compared agree/disagree questions with item-specific ones, which ask about the thing itself (“How easy was checkout?” rather than “Checkout was easy: agree or disagree?”). Answers to the agree/disagree versions were of much lower quality (Saris et al., 2010). The grid is the natural habitat of the agree/disagree statement, because it is the only scale that fits every row.
The other side deserves a fair hearing. Mingnan Liu and Alexandru Cernat found similar straightlining and similar response times in matrix and item-by-item versions, although the matrices had more skipped items, especially on phones (Liu and Cernat, 2018). Matthew DeBell and colleagues found only small differences in a US probability panel; they prefer single items when quality matters most but accept short, well-built grids (DeBell et al., 2021). Several studies found no extra breakoff in grids either. So a grid is not poison. A grid doesn’t make people careless; it makes carelessness cheap.
What happens to a matrix question on a phone?
Most survey answers now come from phones. In data from four large online panels across 13 countries, 61% of completed surveys in 2023 were done on a mobile phone (MRS, 2024). Probability panels are getting there too: in the German Internet Panel, 49% of respondents used a smartphone in March 2025, against about 4% in 2012 (University of Mannheim, 2025).
A grid built for a laptop has three ways to reach that phone, and survey tools use all of them.
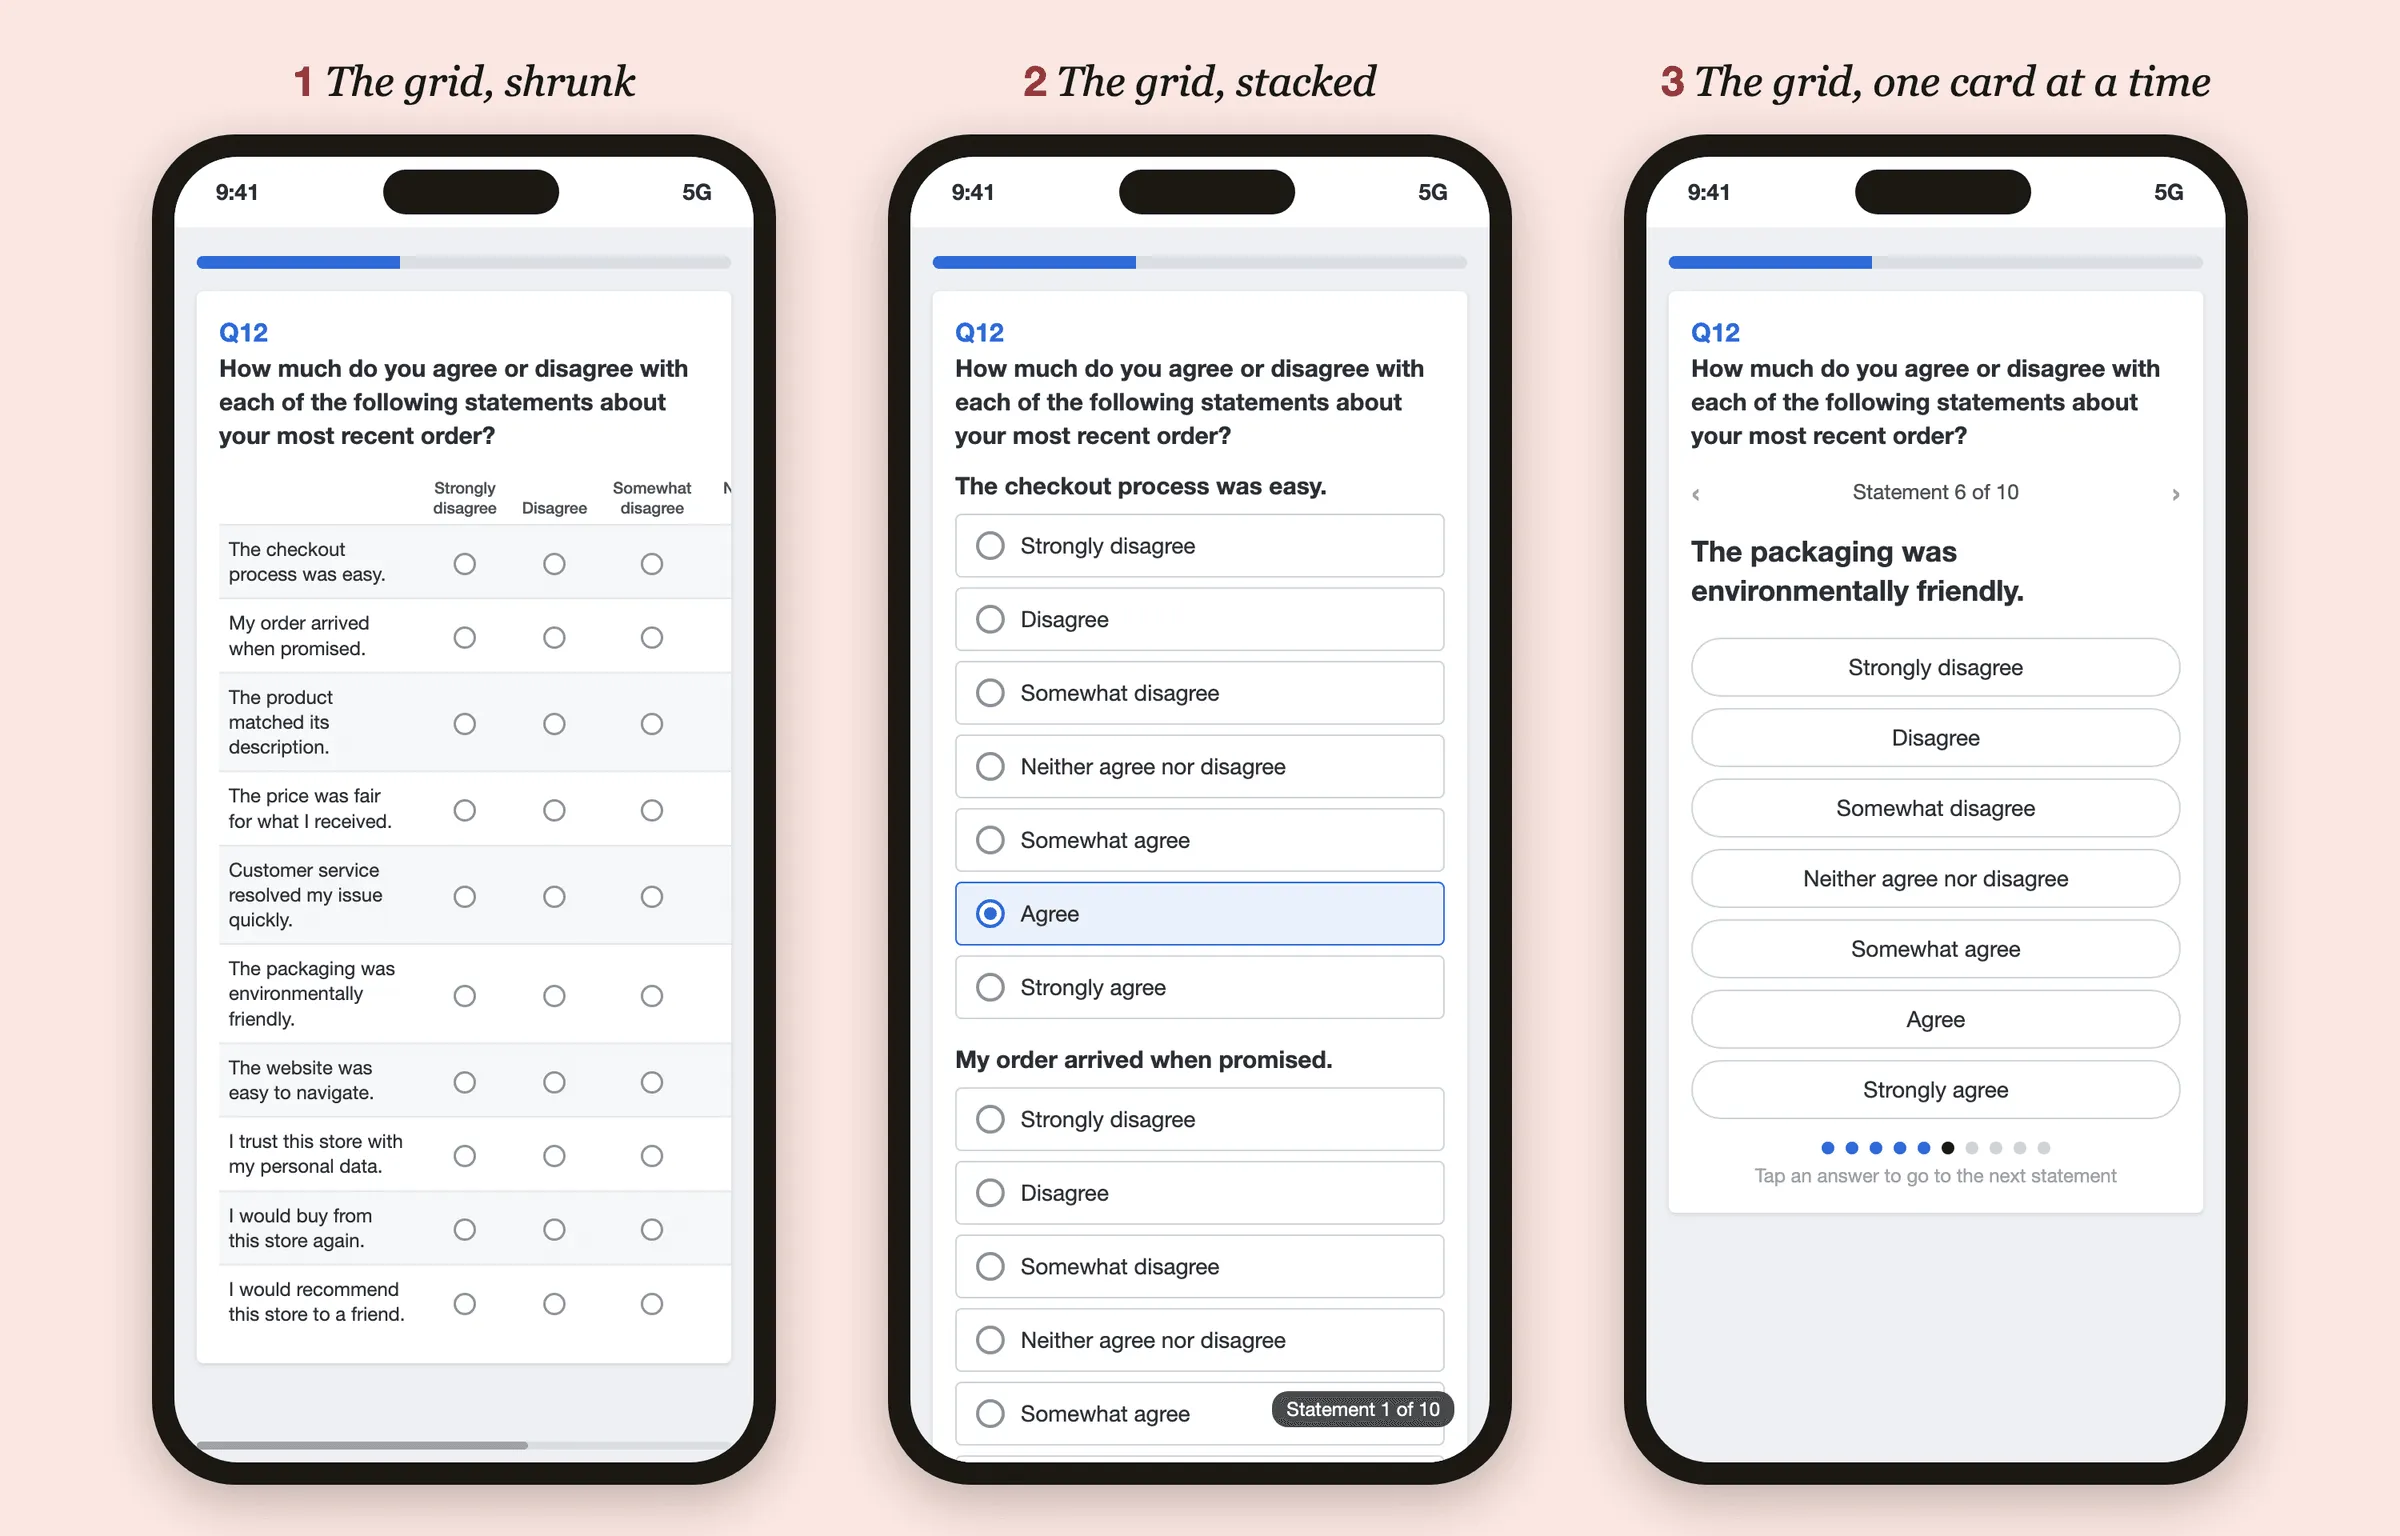
Shrunk. The table keeps its shape and shrinks. Statements wrap onto three lines, the column labels shrink to tiny print, and the answer circles end up around 14 pixels wide, a third of the 44 points Apple recommends as the minimum for anything you tap (Apple); Android’s says 48 (Android Developers). Often the right-hand columns fall off the screen, so “Agree” and “Strongly agree” exist only for those who think to swipe sideways. In a 2004 experiment with drop-down lists, the options people could see without scrolling were picked more often than the ones they had to scroll to (Couper et al., 2004). A grid that runs off the edge of a phone looks to me like the same trap, turned on its side.
Stacked. Every statement becomes its own question with seven full-width buttons, so the respondent scrolls through seventy of them. This is the honest version: it shows what the grid always was, ten questions. It also works better. In a Slovenian experiment with 4,644 panelists, nearly half of them on smartphones, the grid’s straightlining ran 19% above the average of the five layouts tested on PCs and 25% above it on phones, while the vertical item-by-item versions held up well (Vehovar et al., 2023). The best was an accordion that opens one item at a time and folds it away once answered. A Spanish panel study came to the same conclusion and recommended item-by-item formats on every device (Revilla et al., 2017).
One card at a time. The carousel deals out one statement per screen and moves on with each tap, which looks elegant in a demo. In the Slovenian study, the horizontal carousel did badly on skipped items: on smartphones its item nonresponse was 197% above the average of the five layouts (Vehovar et al., 2023). You lose sight of your earlier answers, and it’s easy to pass a statement without answering it.
The format suffers more on the small screen than on the big one. One study found that grids saved more time on mobile devices than on computers and increased non-differentiation more (Stern et al., 2016). In the Slovenian experiment, the grid showed the largest gap between PC and smartphone answers of any layout, and the authors concluded that grids should be dropped on PCs as well. Grids weren’t even faster there than the vertical alternatives. A review of a decade of smartphone studies gave the same advice: avoid horizontal scrolling and large grids (Antoun et al., 2018). The American Association for Public Opinion Research said so in 2014, when it suggested breaking grids into single questions for mobile (AAPOR, 2014).
Why “mobile-friendly” doesn’t fix it
Here is the part that bothers me. Questionnaires are still written on laptops, by people looking at the desktop preview, where ten statements look like one question. The software then converts the grid for phones, and the conversion can rearrange the circles but can’t delete a single statement. “Mobile-friendly” becomes a setting applied after the thinking is over, not a design.
So the respondent on a phone gets the full bill: the ten statements nobody cut, the seven points nobody needed, the agree/disagree wording nobody questioned. Very often that respondent is someone answering for small change on a panel site, as I described in Are paid survey sites worth it?, and the straight lines that follow get blamed on them. A Dutch study back in 2009 already showed the trade-off: the more items per screen, the faster people finished, the more they skipped and the less they liked the layout (Toepoel et al., 2009). Fast and unhappy is not a result anyone should be designing for.
How to ask the same thing without a grid
- Cut the items. If a grid has ten statements, four of them probably drive a decision and the rest are there because someone in the meeting asked. Ask the four.
- Ask about the thing, not about agreement. “How easy was checkout?” with answers from very easy to very difficult beats “Checkout was easy” on an agreement scale.
- Use five labeled points as big vertical buttons. One item at a time, or an accordion if your tool has one. Never make anyone scroll sideways, and skip the carousel.
- If you keep a grid, keep it short. Three or four rows, short labels, and test it on the oldest phone in the office before anyone else sees it.
- Read straight lines as a review of your questionnaire. Before you delete the straightliners as low quality, ask what you did to produce them.
None of this is new. AAPOR told the industry to break up grids for phones in 2014, and the research behind the rest goes back more than twenty years.
My take
The grid survives because its costs land on someone who isn’t in the room. The author sees one tidy question, the client sees one chart, and the survey platform sees one more feature to list. The respondent sees ten questions on a five-inch screen, for a few cents, and answers the way anyone would. Then we clean the data, find the straight lines and blame the respondents. That is the trade hollowing itself out, the argument of You killed market research, one questionnaire at a time.
One matrix question doesn’t kill a survey. But we ask them by the hundred, in surveys that look short only on the author’s laptop, and each one teaches another person that answering surveys is a chore you get through by clicking down a column. That is how a trade loses its respondents. Not with a bang, but with a nail at a time.
In the next post I’ll look at the big enterprise survey platforms, where most respondents meet these grids in the first place.
Questions people ask
What is a matrix question in a survey?
A set of statements or items, shown as rows, that share one answer scale, shown as columns. The respondent picks one column in every row. It is also called a grid, a matrix table or a rating-scale battery.
Are matrix questions bad?
Not in themselves, but they make careless answering cheap. Experiments find more straightlining and lower validity in grids than in the same items asked one at a time, and the gap is larger on smartphones. A short grid of three or four items does much less harm than a long one.
How do you make matrix questions mobile-friendly?
Mostly by not using them. Ask the items one at a time, stacked vertically, with large labeled answer buttons, and never make people scroll sideways. In a 2023 experiment an accordion layout that opens one item at a time did best on phones, while a horizontal carousel led to far more skipped answers.
What is straightlining in surveys?
Giving the same answer to every item in a set, usually by clicking straight down one column of a grid. A few straight lines are honest; long ones usually mean the respondent stopped reading, which is why they are a standard warning sign in data cleaning.