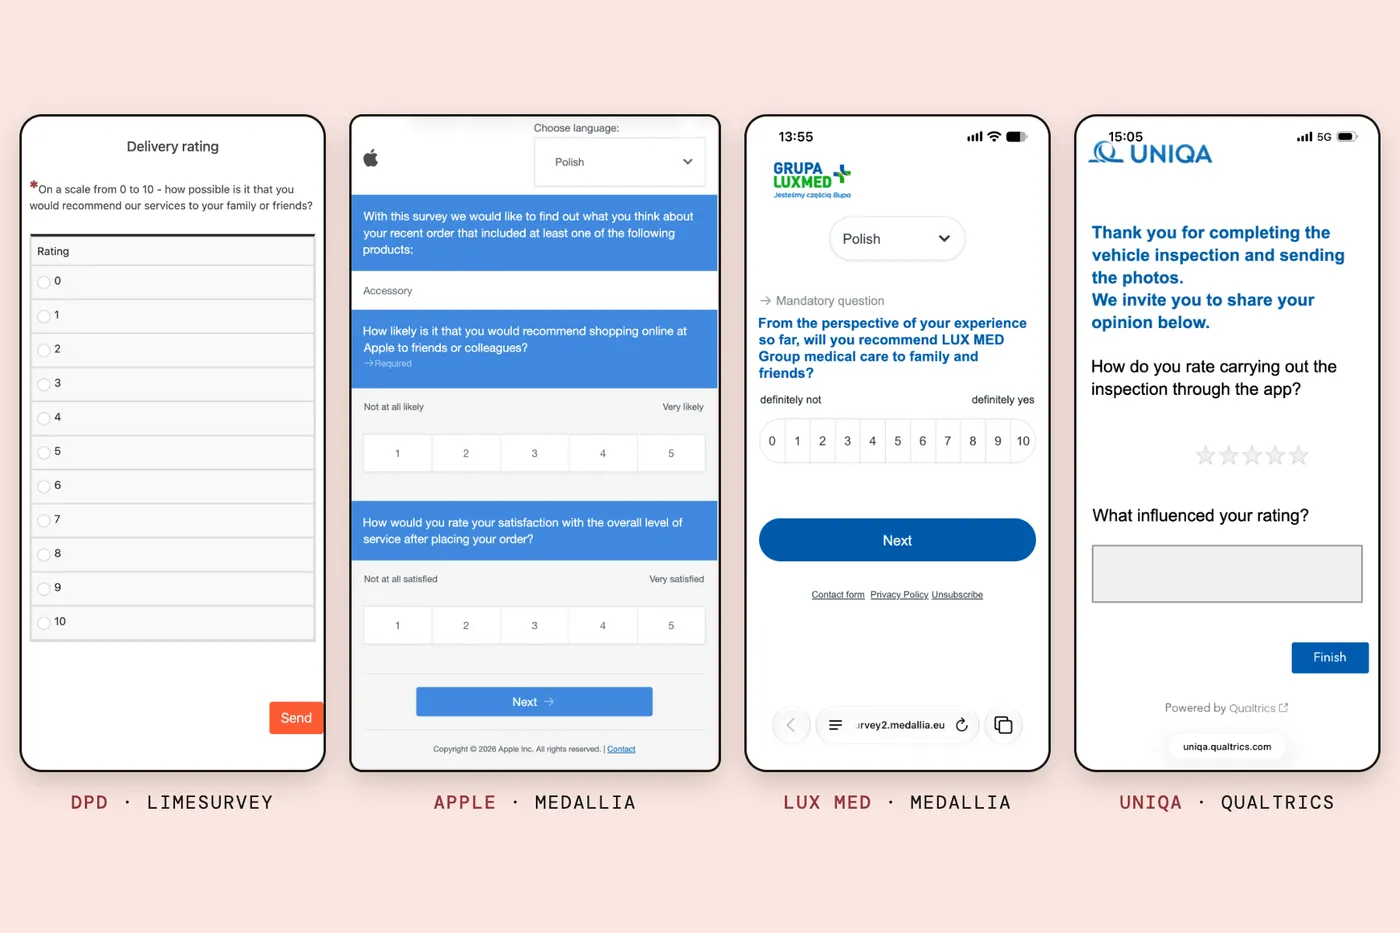
In the post on matrix questions I promised to look at the big survey platforms, where most people meet those grids in the first place. So I kept the customer surveys that reached me this year. Four of them are below: a parcel carrier, Apple, a private healthcare group and an insurer, running on three platforms, LimeSurvey, Medallia and Qualtrics. They were in Polish; I translated the text and left everything else as it was.
What do bad survey design examples look like in real life? Not like a scandal. They look like these: careless in a dozen small ways, and every one of them lands on the person answering. A scale with no labels, the recommendation question on a scale it wasn’t made for, buttons sized for somebody else’s thumb, and the survey vendor’s name in the address bar, where the brand should be.
My view is that customer surveys look like this because they are built for the people who buy the software, not for the people who fill it in. The dashboard gets a designer. The questionnaire gets the default.
DPD: a recommendation scale with no labels
DPD Polska sends a survey after a delivery. I opened it on November 13, 2026, on a laptop and on a phone-sized screen, and submitted nothing. It is one page titled “Delivery rating”, and its one required question is not about the delivery: it asks how likely I am to recommend “our services” to family or friends, on a scale from 0 to 10.
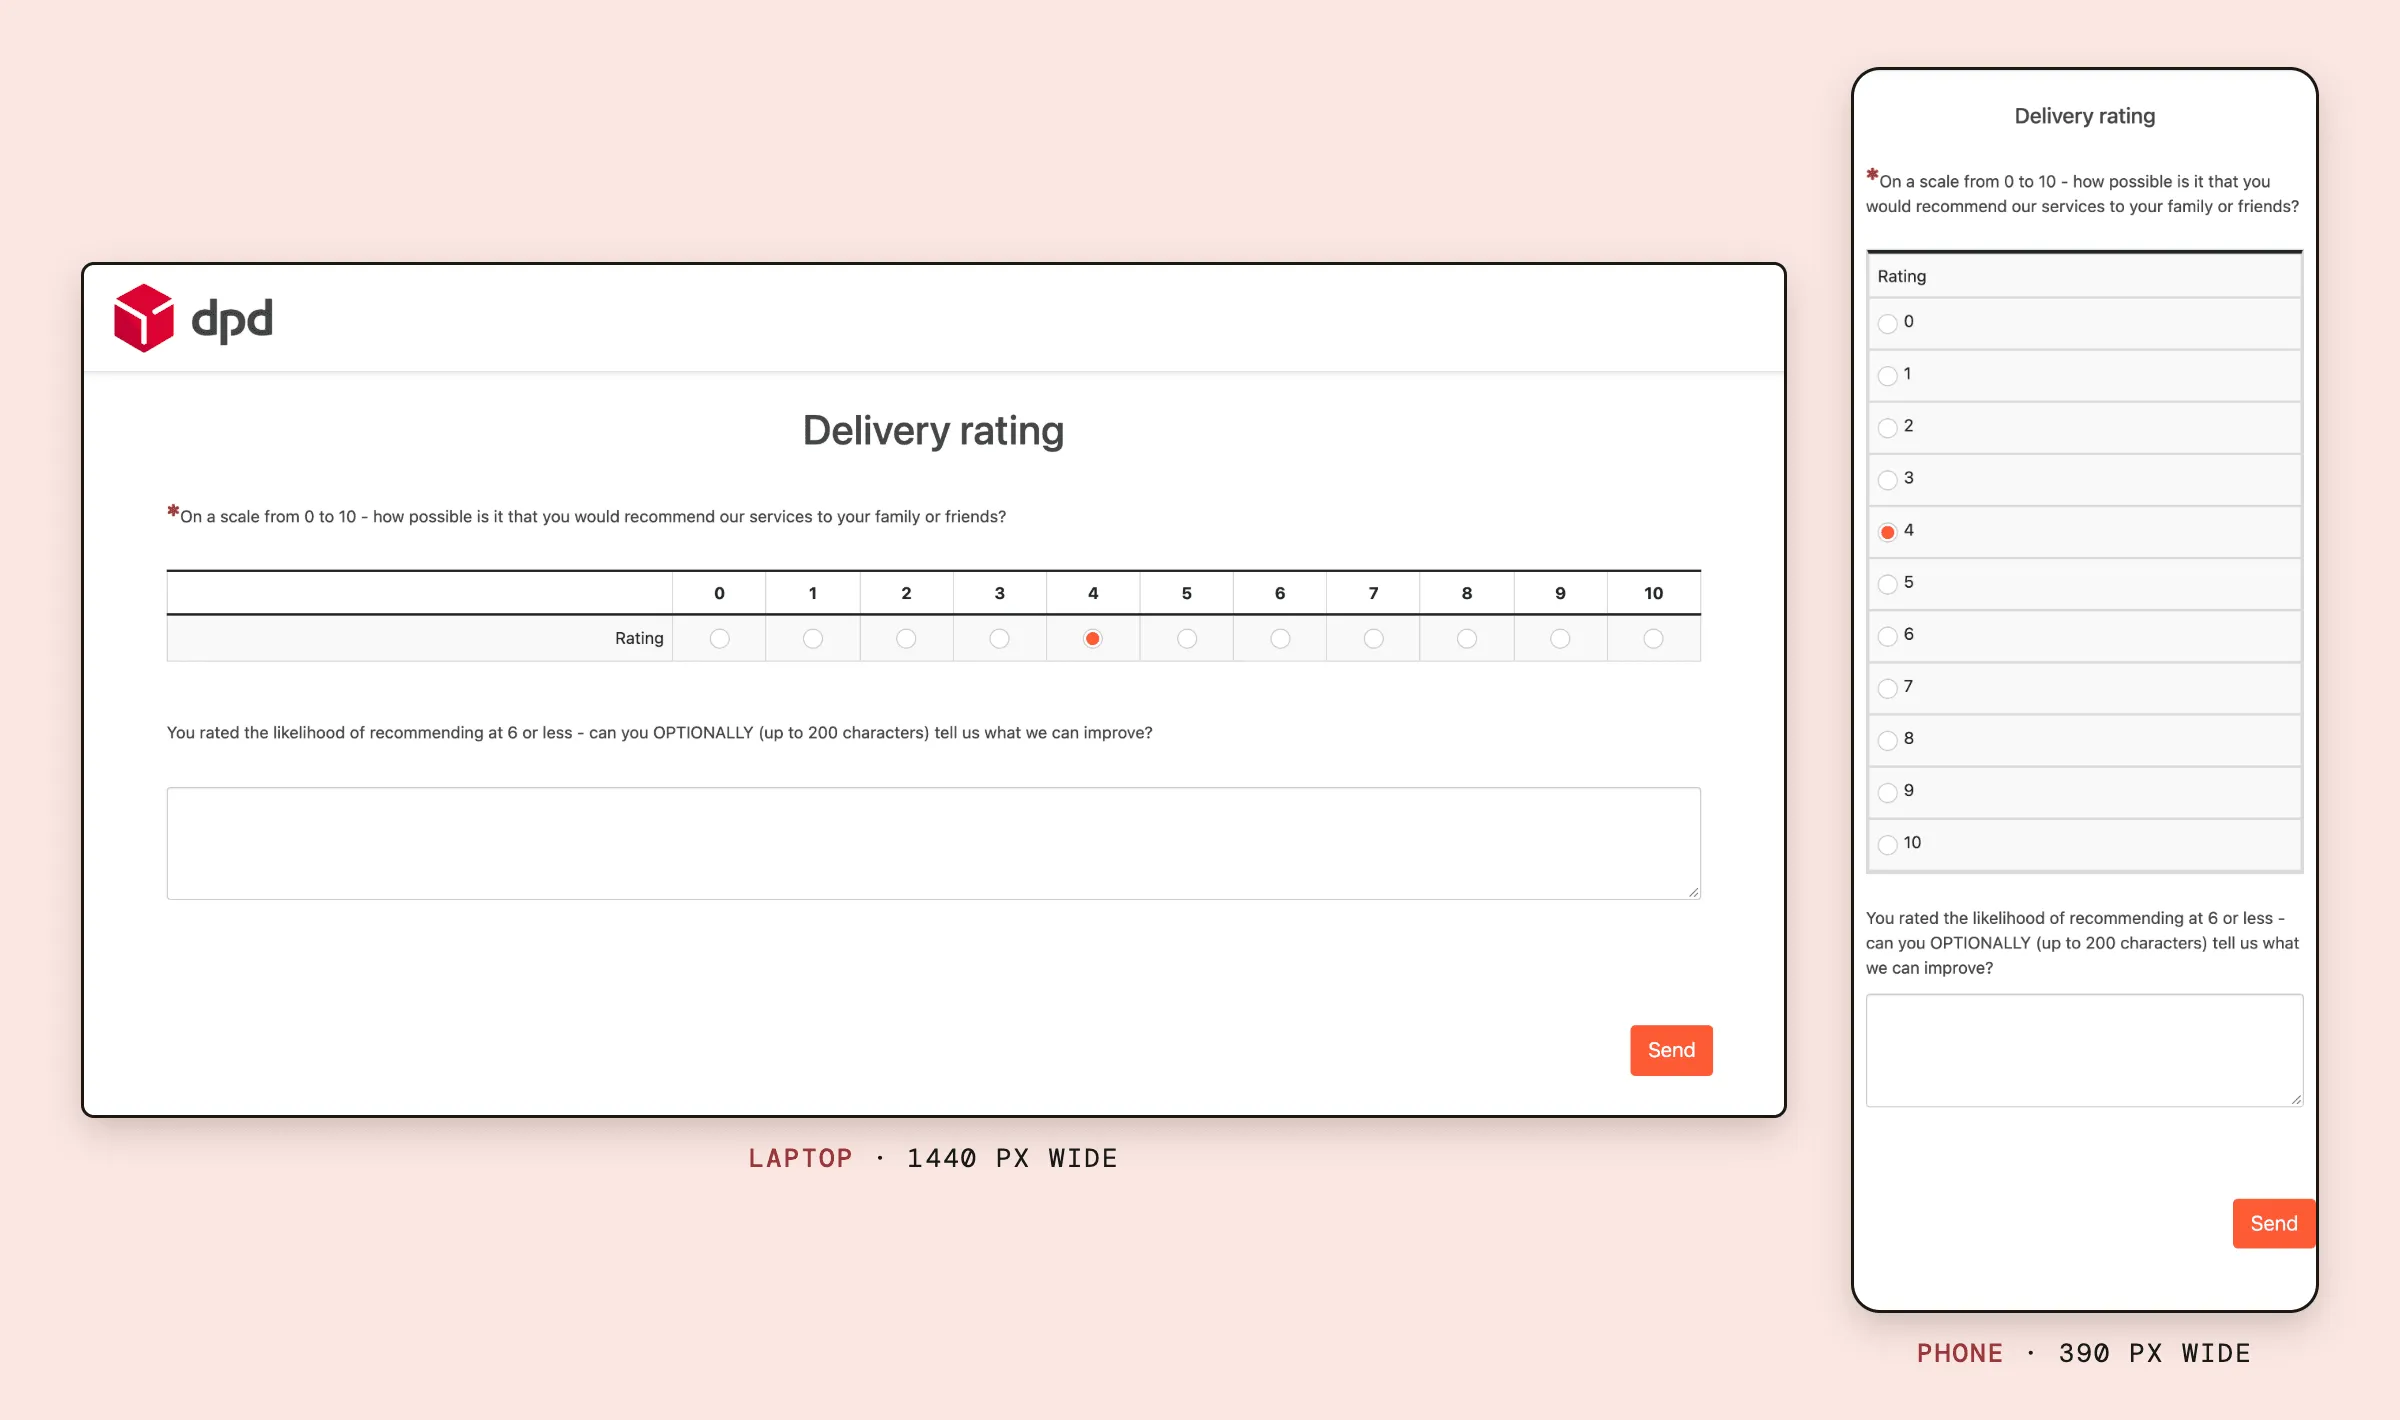
That is the question behind the Net Promoter Score, which I took apart in Is NPS dead?, and it comes with no labels at all. Nothing tells you whether 0 means “never” or “not sure”.
The survey platforms’ own documentation describes the scale as running from 0, “not at all likely”, to 10, “extremely likely” (Medallia), and Qualtrics puts those two labels in by default and recommends keeping them (Qualtrics). Research asks for more, not less: studies comparing fully labeled scales with scales labeled only at the ends found the fully labeled ones gave more reliable answers (Maitland, 2009). DPD labels nothing.
The layout is a grid with a single row, called “Rating”, and a wide empty column on its left. On a phone the grid turns into a vertical list of eleven rows, 0 at the top and 10 at the bottom, the DPD logo disappears, and the Send button sits flush against the right edge of the screen.
Pick 6 or less and a second question appears: “can you OPTIONALLY (up to 200 characters) tell us what we can improve?” The capitals are DPD’s. There is no character counter.
The Polish is worse than my translation can show. “How possible is it” is a literal rendering of a phrase no Polish copywriter would sign off on, and the follow-up has a grammatical error. Polish verbs have gender, so the first question hedges with “polecił(a)byś”, “would you (m./f.) recommend”, and the second forgets and addresses only men.
The tool is LimeSurvey, which is open source and runs here on DPD’s own domain. That deserves credit: the address bar shows a DPD address.
The page itself is LimeSurvey’s core “Fruity” theme, extended with a DPD logo and an orange button next to the red logo. LimeSurvey’s manual says the front end can be fully customized (LimeSurvey). Nobody did.
Apple: the NPS question on a five-point scale
Apple sends a survey after an online order, and the invitation link points to survey.medallia.com. The first page asks: “How likely is it that you would recommend shopping online at Apple to friends or colleagues?” That is the NPS wording almost word for word. The answer scale runs from 1 to 5.
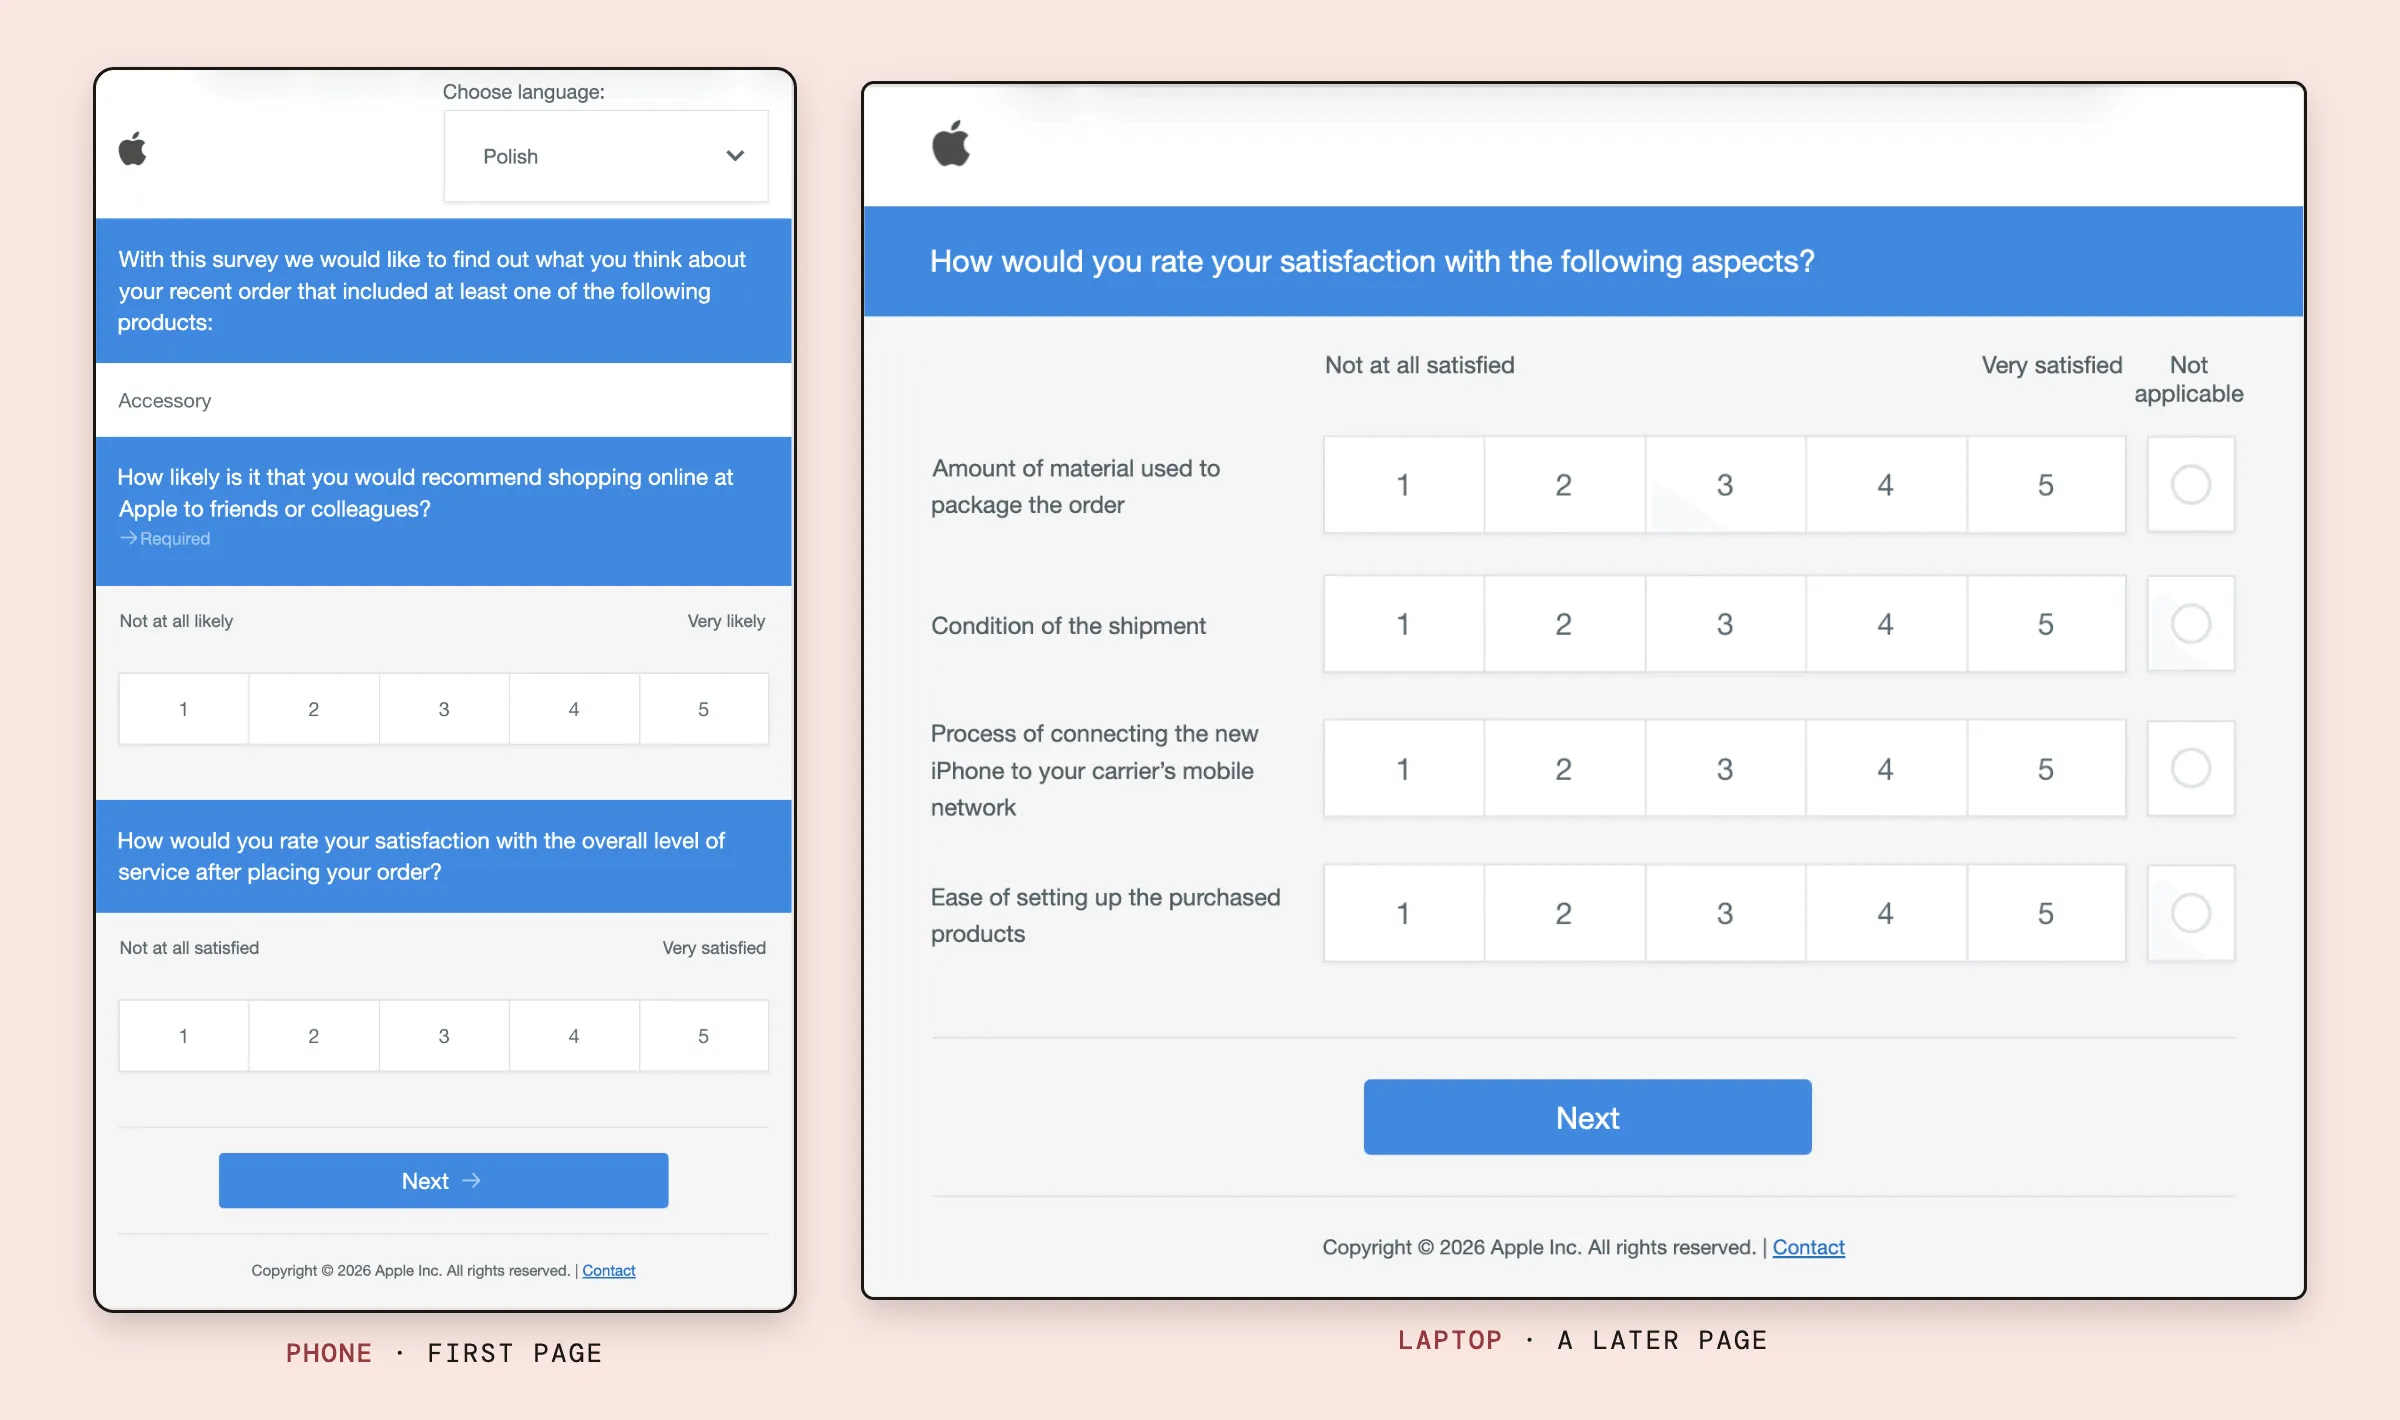
Whatever Apple calculates from those answers, it is not a Net Promoter Score, and it can’t be compared with anyone else’s. I suspect two people won an argument here: one who wanted the famous question, and one who wanted fewer buttons on a phone. Both were half right.
The rest is small and telling. The product list says “Accessory”, in English, in an otherwise Polish survey. The scale labels hedge on gender with “zadowolony(-a)”, satisfied with a feminine ending in brackets.
A later page is a grid of four items, from the amount of packaging to “connecting the new iPhone to your carrier’s mobile network”, and the “Not applicable” answer is drawn as a circle next to four rows of numbered boxes, so the one answer that says “this isn’t about me” looks like a different kind of question. To me the whole thing doesn’t look like Apple at all: blue bars, generic type, a layout that could belong to any utility.
Then there is the address. Apple’s own guide to phishing lists, among the warning signs, a link that looks right while “the URL doesn’t match the company’s website” (Apple). An email that says it is from Apple and sends you to medallia.com is exactly what that advice teaches people to distrust.
LUX MED: eleven buttons in one row
LUX MED, one of Poland’s large private healthcare groups, asks the recommendation question properly: 0 to 10, with “definitely not” and “definitely yes” at the ends. The trouble is where it puts them. All eleven answers sit in one row across the width of a phone.
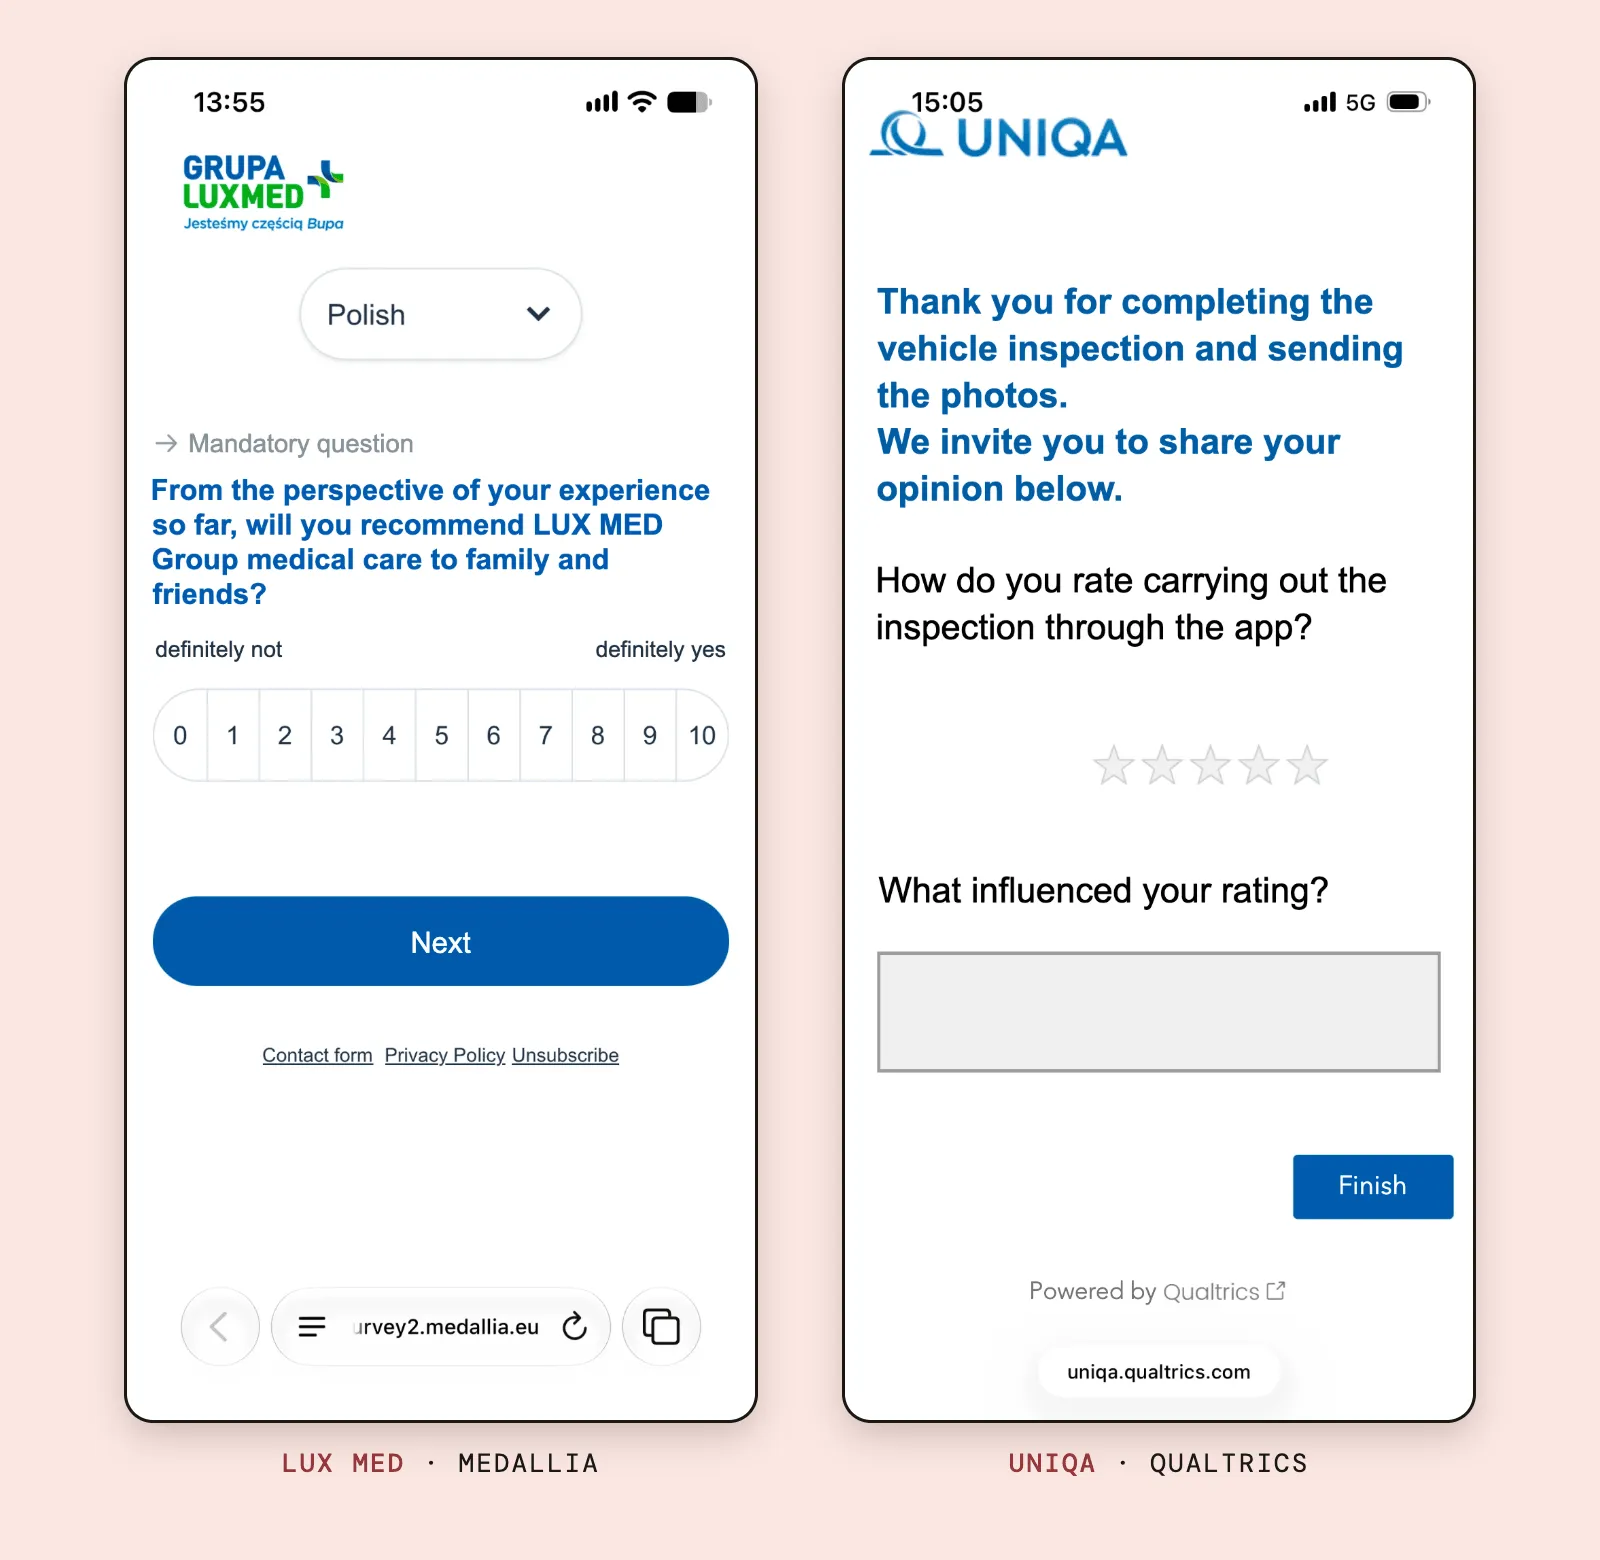
By my measurement each button is roughly 31 to 36 points wide, depending on the phone. Apple asks for at least 44 points for anything you tap (Apple), Android for 48 dp (Android Developers). The row does clear the 24-pixel floor in the web accessibility guidelines (W3C), which tells you how low that floor is. Nor is this one company’s slip: Qualtrics’s documentation says that in its newer survey layout the NPS question defaults to a horizontal format on small screens (Qualtrics).
The language gives the setup away again. The language picker says “Polish”, in English. The footer says “Contact form”, “Privacy Policy” and “Unsubscribe”, in English, under a survey written for Polish patients. The address bar reads survey2.medallia.eu.
UNIQA: five pale stars, off center
UNIQA, the insurer, asked about a vehicle inspection I had done through its app. The page opens with a thank-you in large bold type, then asks how I rate “carrying out the inspection through the app”, over five small, light gray stars. By my measurement each is about 25 points across, and the row sits right of center, under nothing in particular. There are no labels, so it’s anyone’s guess whether three stars means “fine” or “bad”.
Below that is a gray text box with a heavy border that, to me, looks disabled, and a Finish button almost touching the right edge of the screen. The footer says “Powered by Qualtrics” and the address bar says uniqa.qualtrics.com. The insurer’s survey advertises its software vendor.
In fairness to the vendor, its documentation offers dynamic themes so that surveys match a company’s brand, says they are free, and says they meet the WCAG 2.1 accessibility standard (Qualtrics). The tools can do better than what their customers ship.
Why do customer surveys look so bad?
Put the four side by side and a pattern shows. Three of them ask whether I would recommend the company, on three different scales: 0 to 10 with no labels, 1 to 5, and 0 to 10 with labels.
None looks as if anyone answered it on a phone before it went out, although phones are where most answers now come from: in four large online panels, 61% of completed surveys in 2023 were done on a mobile phone (MRS, 2024). And it matters. A meta-analysis of 14 studies found that surveys optimized for mobile devices, and surveys with simpler designs, lose fewer respondents halfway through (Mavletova and Couper, 2015).
None of it is a technical limit. LimeSurvey can be redesigned from scratch, Qualtrics offers branded themes for free, and nothing in any platform forces anyone to put an unlabeled scale on a page. The respondent’s screen looks like this because nobody owns it.
My guess at how that happens: a customer experience team buys the platform for its dashboards, alerts and benchmarks. The questionnaire is set up by whoever has time, and the translation goes to whoever speaks the language, or to nobody.
I think the companies pay for this twice. Once in data: an unlabeled scale, a five-point “NPS” and a row of buttons too small to hit each add noise to the number that ends up on the slide.
And once in attention. As I argued in Participation is not engagement, a completed survey proves that someone clicked through, not that they thought about it. A survey that looks like an afterthought gets afterthought answers, from the few people who still answer at all.
How to fix bad survey design
- Design it on a phone first. One question per screen, answer buttons at least 44 points across, no grids, no horizontal rows of eleven.
- Label the scale and keep it. At least the ends, better every point; and the same question on the same scale every time, or the trend line means nothing.
- Ask the NPS question as NPS, or don’t call it that. 0 to 10, labeled. A five-point recommendation question is fine, but it is a different number.
- Put it in your own clothes. Your design, and if possible your own domain, so the link looks like it came from you.
- Have a native speaker answer it on a phone before launch. Someone who didn’t write it, on an ordinary phone, with no instructions.
- Keep it short. DPD got this part right: one question, and a second only when the answer calls for it.
My take
For many companies, the survey is the only time they ask a customer anything. They spend money on the platform, the dashboards and sometimes an NPS target in the bonus plan, which, as Goodhart’s law predicts, is where the number starts to go wrong. Then they ask the question with a page nobody tested on a phone, in a language nobody checked, at an address the customer is trained to distrust.
The respondent notices. Every survey like these four teaches someone that giving feedback is a chore and that nobody on the other end cared enough to look at the form. I don’t think that is a design problem. It is a respect problem that happens to be visible in the design, and it is fixed the same way: by having somebody who matters answer the survey themselves, on a phone, before the customers do.
Questions people ask
What are examples of bad survey design?
Scales with no labels, the recommendation question on a scale it wasn’t built for, rows of buttons too small for a thumb, grids, untranslated text and links to a domain the customer has never heard of. Each of the four real surveys in this post shows several of these.
How do you make a customer survey mobile-friendly?
Design it on a phone first. One question per screen, answer buttons at least 44 points (Apple) or 48 dp (Android) across, labeled scales laid out so a thumb can hit every point, no grids, and a test on a real phone by someone who didn’t write it.
What scale should an NPS question use?
0 to 10, with ‘not at all likely’ and ‘extremely likely’ at the ends. That is how Bain’s method defines it and how the survey platforms’ own documentation describes it. Answers on a 1 to 5 scale can’t be turned into a Net Promoter Score or compared with one.